 What can cycling do to reduce CO2 emissions in Bremen? Here we calculate what has been done, what hasn’t, and what can be done in the coming decade.
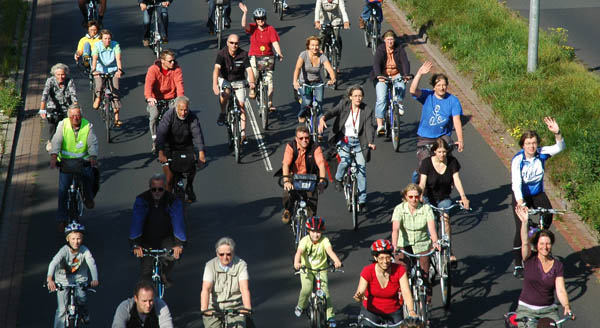
With Fridays for Future developing a regular presence on the streets of Bremen, a transport transition blog like Bremenize must surely be asking – what can cycling do in response to the climate emergency? Generalised answers to this question abound in the cycling advocacy world, amongst concerned politicians, in Bremen’s new coalition agreement, and indeed amongst Fridays for Future activists, or at least amongst those living in a country with a cycling culture.
But beyond “Transport Transition” or “cycle more”, the details are thin. A growth in cycling won’t lead to a reduction in CO2 emissions if the increase is at the expense of walking or public transport. Using cycling as a tool to combat climate change requires parallel measures to discourage car use.
The Problem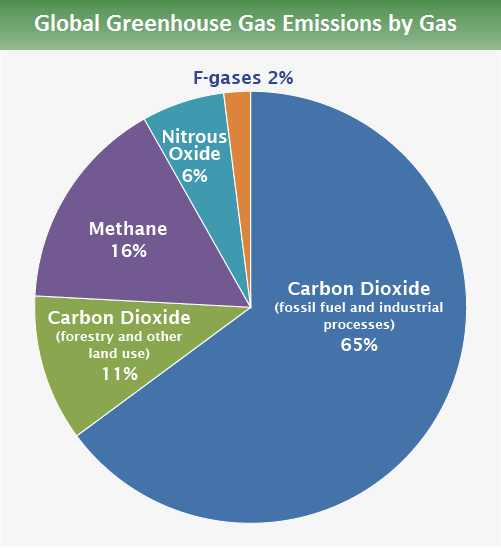
It is generally agreed that, if we are to avoid climate catastrophe, greenhouse gas emissions globally need to be cut by 55% by 2030, compared to 1990 figures.
By 2050, global industries will need to be completely decarbonised. Carbon dioxide emissions are the largest contributor to human-induced warming, and, therefore, are one of the most critical signposts to watch. After an apparent stabilising of global CO2 emissions between 2012 and 2015, they are back on the rise, from 35 gigatonnes in 2015 to 37 gigatonnes in 2018.
Europe is fairing better than most of the developed world, but progress here is also slowing. Greenhouse Gas Emissions are declining but at a slowing pace, just when we need to urgently speed up this process. Drill down to the figures for the major emitting sectors of human activity, and we soon see the culprit. Greenhouse gas emissions in Europe have fallen by 23.5% since 1990. In virtually every sector, emissions have declined in this period – power generation by 30%, for example. Only the transport sector has seen an increase. Transport is now Europe’s biggest source of carbon emissions.![]() What is actually happening in Europe is that other sectors are having to compensate for road transport’s poor record. It’s almost as if the energy employed in insulating housing, installing solar and wind energy sources, and slowly shifting agriculture to a more sustainable basis, is thoroughly lacking in the road transport sector.
What is actually happening in Europe is that other sectors are having to compensate for road transport’s poor record. It’s almost as if the energy employed in insulating housing, installing solar and wind energy sources, and slowly shifting agriculture to a more sustainable basis, is thoroughly lacking in the road transport sector.
Bremen’s Response
So what about Bremen? To help understand our state’s situation we need to turn to our Climate Protection and Energy Programme 2020 ( or KEP). This was originally published in 2010, looking back 20 years to 1990 as the base year, and forward 10 years to 2020 as the first target for reductions. This is useful as it included what had “already been done” (or not!) by 2010. The programme targeted a 40% reduction in C02 emissions by 2020. However, nowhere did the document explain exactly why 40% was chosen. Moreover, this figure excluded the steelworks on the banks of the Weser. In 2010 this produced 45% of Bremen’s emissions.
In fact the best and most concrete scenario that KEP could offer was a 25.6% reduction. By excluding the steel industry from all calculations, this was raised to 33%. But these targets have already been abandoned, with 13% to 16% reductions looking more likely.
In absolute figures, in 1990 the State of Bremen emitted 11,912 kilotons of CO2, or 7,081 kilotons without the steel industry. So the most ambitious target envisaged reductions of 2,346 kilotons without, or 3,045 kilotons with the steel industry. Excluding steel, the KEP broke these reductions down into 4 sectors – industry, transport, housing and services, and waste handling. The rapid increase in waste management required a growth in that sector’s CO2 emissions, offset by the other 3 sectors’ reductions. The hoped-for reductions were as follows:
- Industry -282 kilotons (-23.3%)
- Transport -578 kilotons (-31.7%)
- Housing/Services -1760 kilotons (-45.9%)
- Waste Management +274 kilotons (+130.2%)
We now know these targets will not be met, but how would these 578 kilotons have been saved? In fact, nearly a third – 180 kilotons – had already been saved when the KEP was written. This is not surprising, since between 1990 and 2008, cycling’s modal share in Bremen rose dramatically on the back of a substantial programme of cycleway building. KEP’s hope was that this would continue to 2020. One scenario, outlined on page 34 of appendix 2 in the KEP, talked of an “ehrgeizigen” (ambitious) cycling programme that would deliver over a half of all CO2 reductions.
But cycling’s modal share stalled after 2010, as transport policy movers in Bremen got sidetracked by vehicular cycling ideas. So where do we go from here?
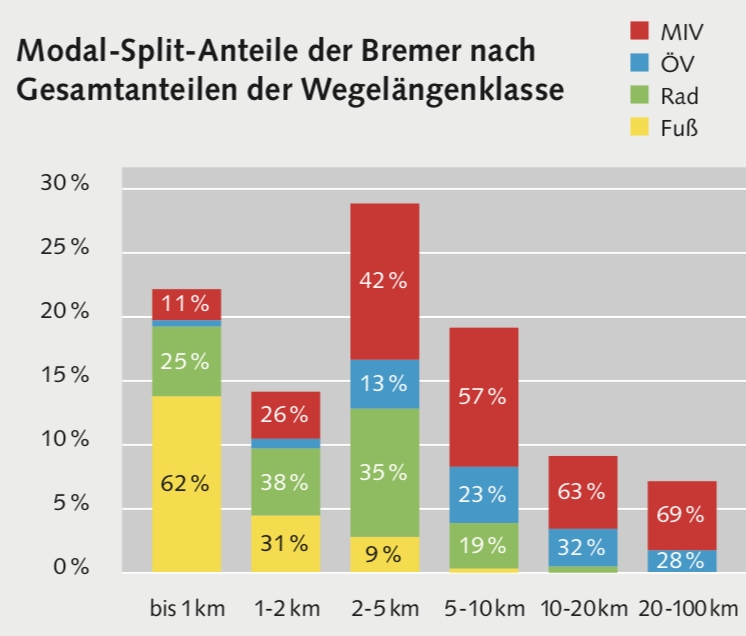
In absolute terms, Bremen’s emissions from all forms of transport were 1,446 kilotons in 2015. The modal split looked something like this:
Switching to Cycling
So how does the bicycle compare with the car, when it comes to CO2? One blogger attempted a calculation back in 2015. She concluded that a cyclist travelling an average 2,700 kilometres per year would produce 11kg of CO2. Using a car for the same journeys would produce 430kg. That’s an annual saving of 419kgs, or 15.518 kgs for every 100 kilometres travelled. Similarly, a new Bremen study of e-bike commuting by BUND Bremen found that on average they saved 17.76 kgs for every 100 kilometres travelled, though this does not take into account the CO2 produced by the e-bike itself. Online carbon footprint calculator figures vary, depending on the year and model of car, from 8 to over 30 kgs/100km. Our blogger’s figures seem to be a reasonable average.
How Many Kilometres Per Day?
A recent study in Vienna concluded that for every 100 cars on the road, 116 people are transported. In other words, the vast majority of car trips are made by single people.
The 2013 TU Dresden study of German towns and cities estimated a total of 541,000 trips per day by private car in Bremen, of which 66%, or 357,000, were under 10 kilometres. Indeed 39% (211,000) were under 5 kilometres. Averaging journeys under 5 kilometres at 3 kilometres (70% are over 2 kilometres), and journeys over at 7.5 kilometres, we reach an estimate of kilometres travelled:
Trips under 5 kms 211,000
Times 3kms average 633,000kms
Trips of 5 to 10 kms 146,000
Times 7.5kms average 1,095,000kms
Total car travel under 10kms 1,728,000kms
75% switched to cycling 1,296,000kms
Trips of 10 to 20 kms 200,000
Times 15kms average 3,000,000kms
Total car travel under 20kms 4,728,000kms
75% switched to cycling 3,546,000kms
26% of 1-2km journeys are made by car, and 42% of 2-5km journeys. It’s not difficult to imagine most of these are possible by cycle. What percentage of these motorised journeys are made by tradesmen with equipment too large to fit into a cargo bike? Or people too old or young to cycle? Or disabled in a way that prevents the use of a bicycle? According to Bremen’s Transport Plan, those fit and able to switch to cycling, the so-called “cycling potential”, could increase cycling’s modal share by 16%, bringing Bremen’s cycle modal share to 40%, and putting it on a par with Copenhagen.
Looking at the figures for journey length, this would require a shift from car use to bike use for 90% of all journeys under 10kms. Given the important role of walking for very short journeys, and public transport for longer ones, a target nearer 75% is more realistic, producing a modal share for cycling of 37%.
But what of those longer trips? In fact, more recent studies emphasise the huge potential of cycling in addressing trips between 10 and 20kms, especially with the growing popularity of e-bikes. The 2013 TU Dresden study estimated these at 184,000 trips per day. And numbers are known to be growing. A conservative estimate for 2019 puts these at 200,000 trips per day or more.
As our calculations show, an ambitious target of converting 75% of all these car journeys to cycling means over 3.5m kilometres per day. Applying our blogger’s conservative calculation of 15.518 kilos saved per 100 kilometres, that amounts to 550 tons daily. Taking into account holidays (weekend car journeys can be just as substantial as weekday journeys), that works out at around 180 kilotons per year.
Now look at the original KEP figures. By 2005, 180 kilotons had already been saved as a result of policies implemented in the 1990s – the period following substantial growth in cycling infrastructure. The vision embodied in KEP was that this would continue. As cycling numbers out-grew the 1980s infrastructure, new, better, cycleways would be built; fast new, and motor traffic-free commuter routes would develop, and road space would be re-allocated from motor vehicles to bicycle. Another 180 kilotons – 12% of all transport emissions in 2015 – could be saved by these measures alone.
Sadly this did not happen. Instead, we have the phenomenon of the cycle street – lite, pleas for cyclists to “share the road”, and growing motor car ownership. We now have 10 years to get back to the KEP’s original vision. Written at a time when radical measures had already been taken, the KEP laid out what was in fact no more than a call to continue the good work. With Bremen’s new Red-Green_Red régime in place, and significant increases in funding for cycling promised, there is hope that at least some of that 180 kilotons will be saved by making easier the switch from car to bicycle.
3 thoughts on “One Hundred and Eighty Kilotons”
Comments are closed.